
AI Reports for Jira and Confluence
Ask your Jira data questions in plain text and get an instant chart, KPI, or table back — no JQL required.
Most AI reporting tools route your Jira data through a third-party SaaS or ask you to bring your own API key. AI Reports calls Claude through Forge's built-in AI — your questions and issue data stay inside Atlassian's infrastructure.
Ask in plain text. Get a chart back
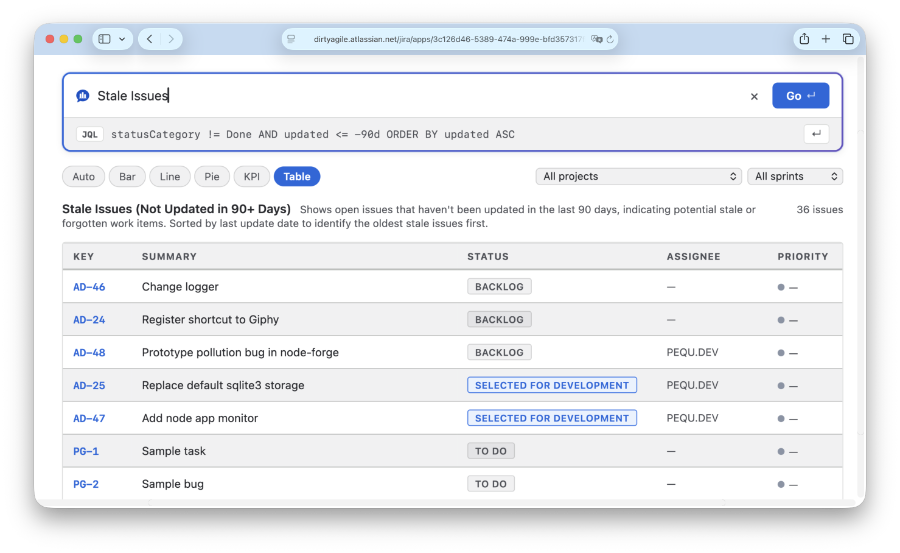
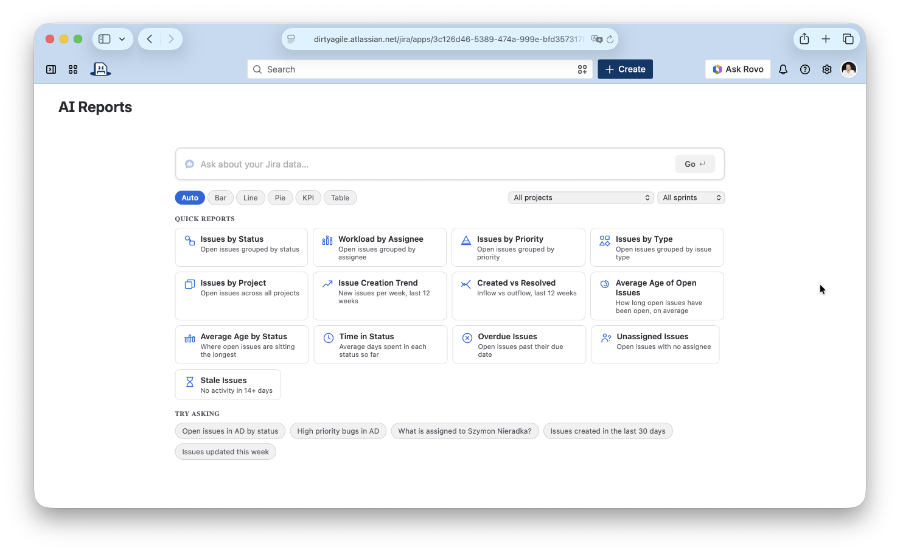
Type a question like "Open bugs by priority in PROJ."
AI Reports translates it into JQL with Claude, runs the query against your real Jira issues, and picks a bar chart, line chart, pie chart, KPI, or table automatically based on what you asked.
The right chart for the question
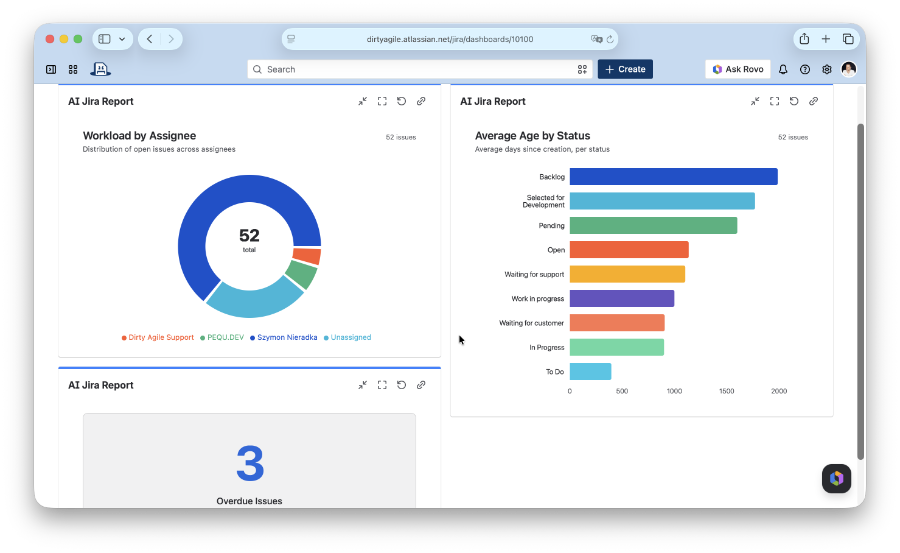
Ask "by status", "by assignee", or "by priority" and get a bar chart. Ask about a trend "over the last 3 months" and get a line chart with weekly or monthly granularity.
Ask "how many" and get a single KPI number. Anything else falls back to a sortable issue table — nothing gets lost.
Real Jira data, not a guess
The JQL Claude writes runs against Jira's API endpoint as the asking user — results reflect your actual issues and respect your existing permissions.
Nothing is summarized or estimated by the model. The chart is built from the same issue data you'd see in a manual JQL search.
Runs on Atlassian
AI Reports is built on Atlassian Forge,
qualifying it for the Runs on Atlassian designation.
Your questions and Jira issue data are processed through
Forge's built-in @forge/llm
— never sent to a third-party AI gateway.
There's no API key to manage and no external server to configure. Install the app and ask your first question.
Learn about Runs on Atlassian →One question, two homes: dashboard and Confluence
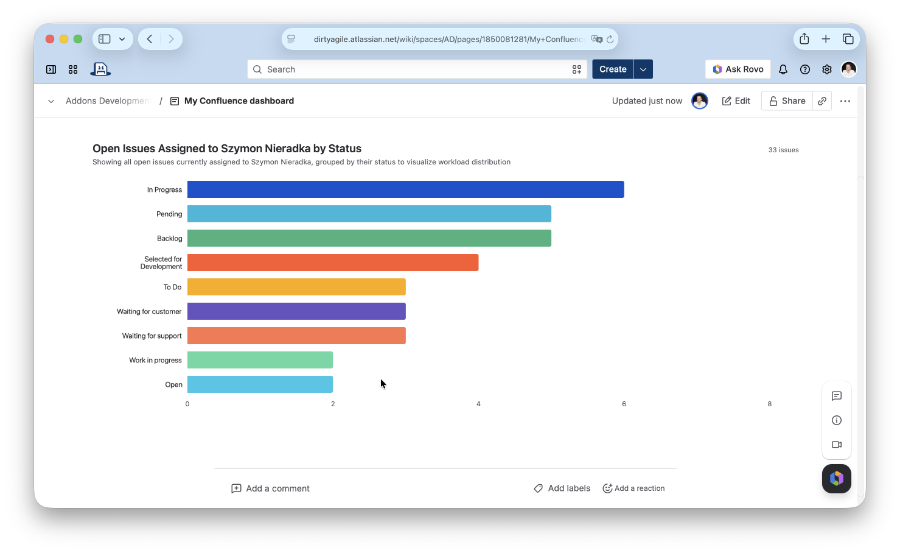
Save any question as a report, then add it as a gadget on your Jira dashboard or a macro on a Confluence page.
Each view re-runs the JQL and refreshes the chart with current data — without spending AI tokens again.
Who uses it
Project & engineering managers
Pull a status snapshot before standup or a stakeholder update by asking "what's overdue in PROJ" — no JQL, no spreadsheet export.
Team leads
Add "Open bugs by priority" or a sprint burndown as a gadget on the team dashboard so everyone sees the same live numbers.
Confluence space owners
Embed a live KPI or chart in a project status page or roadmap that stays current without manual screenshots.
Anyone who doesn't know JQL
Ask "what's assigned to me" or "bugs I reported last week" in plain text instead of learning Jira's query syntax.
In October 2021 we were deeply moved by the situation at the Polish-Belarus border where thousands of people were trapped at the center of an intensifying geopolitical dispute.
We decided to pay 10% of our revenue (not profit, revenue) to a coalition of human rights organizations Border Group. The group includes people we know in person, as well as members of the Helsinki Foundation for Human Rights.
In February 2022 the border crisis seemed to shade. But as we all know it was replaced by something much worse. We hoped we would never use word “war” in this context.
We donate help for fighting Ukraine. Either through NGOs or via our network of friends who are personally involved in the matter.