June 27, 2026
From SQL dump to ERD in Confluence — in under a minute
Paste a CREATE TABLE SQL snippet into Database Schema Diagram and get a live, interactive entity-relationship diagram on your Confluence page — no manual boxes.
If you already have a SQL schema, you shouldn’t have to draw the diagram by hand. Database
Schema Diagram for Confluence can read your CREATE TABLE statements directly and turn them
into a live ERD — foreign keys and all — in about 60 seconds.
This is the SQL import path. If you’d rather start from a blank canvas, see the earlier post on adding an ER diagram to a Confluence page manually.
1. Copy your SQL schema
You need CREATE TABLE statements with column definitions. A pg_dump --schema-only output
works directly. So does any MySQL or SQLite dump, or a hand-written migration file.
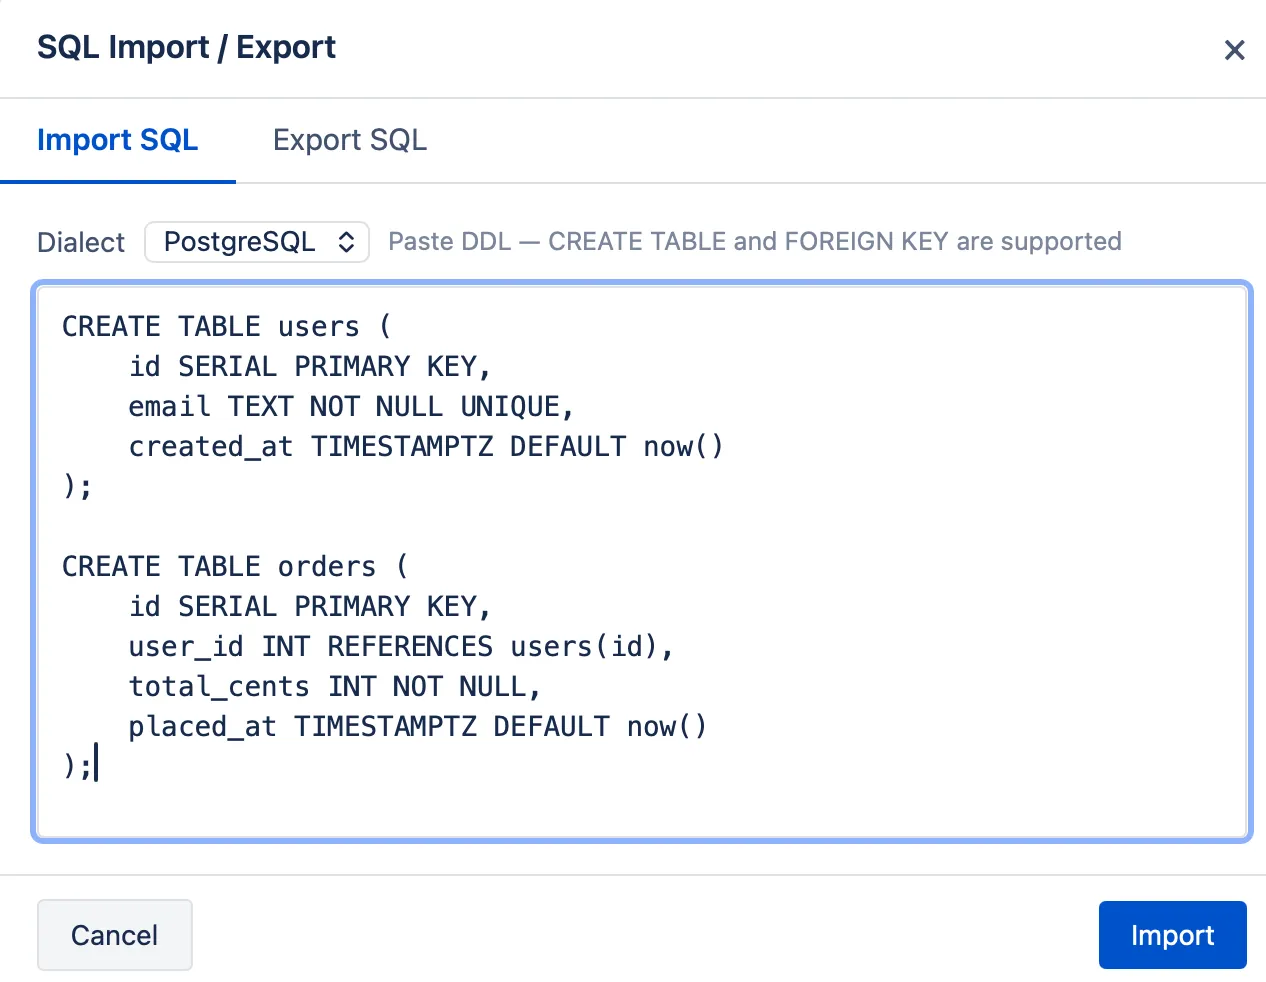
Example — paste something like this:
CREATE TABLE users (
    id SERIAL PRIMARY KEY,
    email TEXT NOT NULL UNIQUE,
    created_at TIMESTAMPTZ DEFAULT now()
);

CREATE TABLE orders (
    id SERIAL PRIMARY KEY,
    user_id INT REFERENCES users(id),
    total_cents INT NOT NULL,
    placed_at TIMESTAMPTZ DEFAULT now()
);
You don’t need the full dump — just the tables you want in the diagram.
2. Insert the macro
In Confluence edit mode, type /database or /schema and select Database Schema
Diagram. The editor opens with a blank canvas.
3. Import the SQL
Click Import SQL in the editor toolbar. Paste your CREATE TABLE statements into the
dialog and confirm.
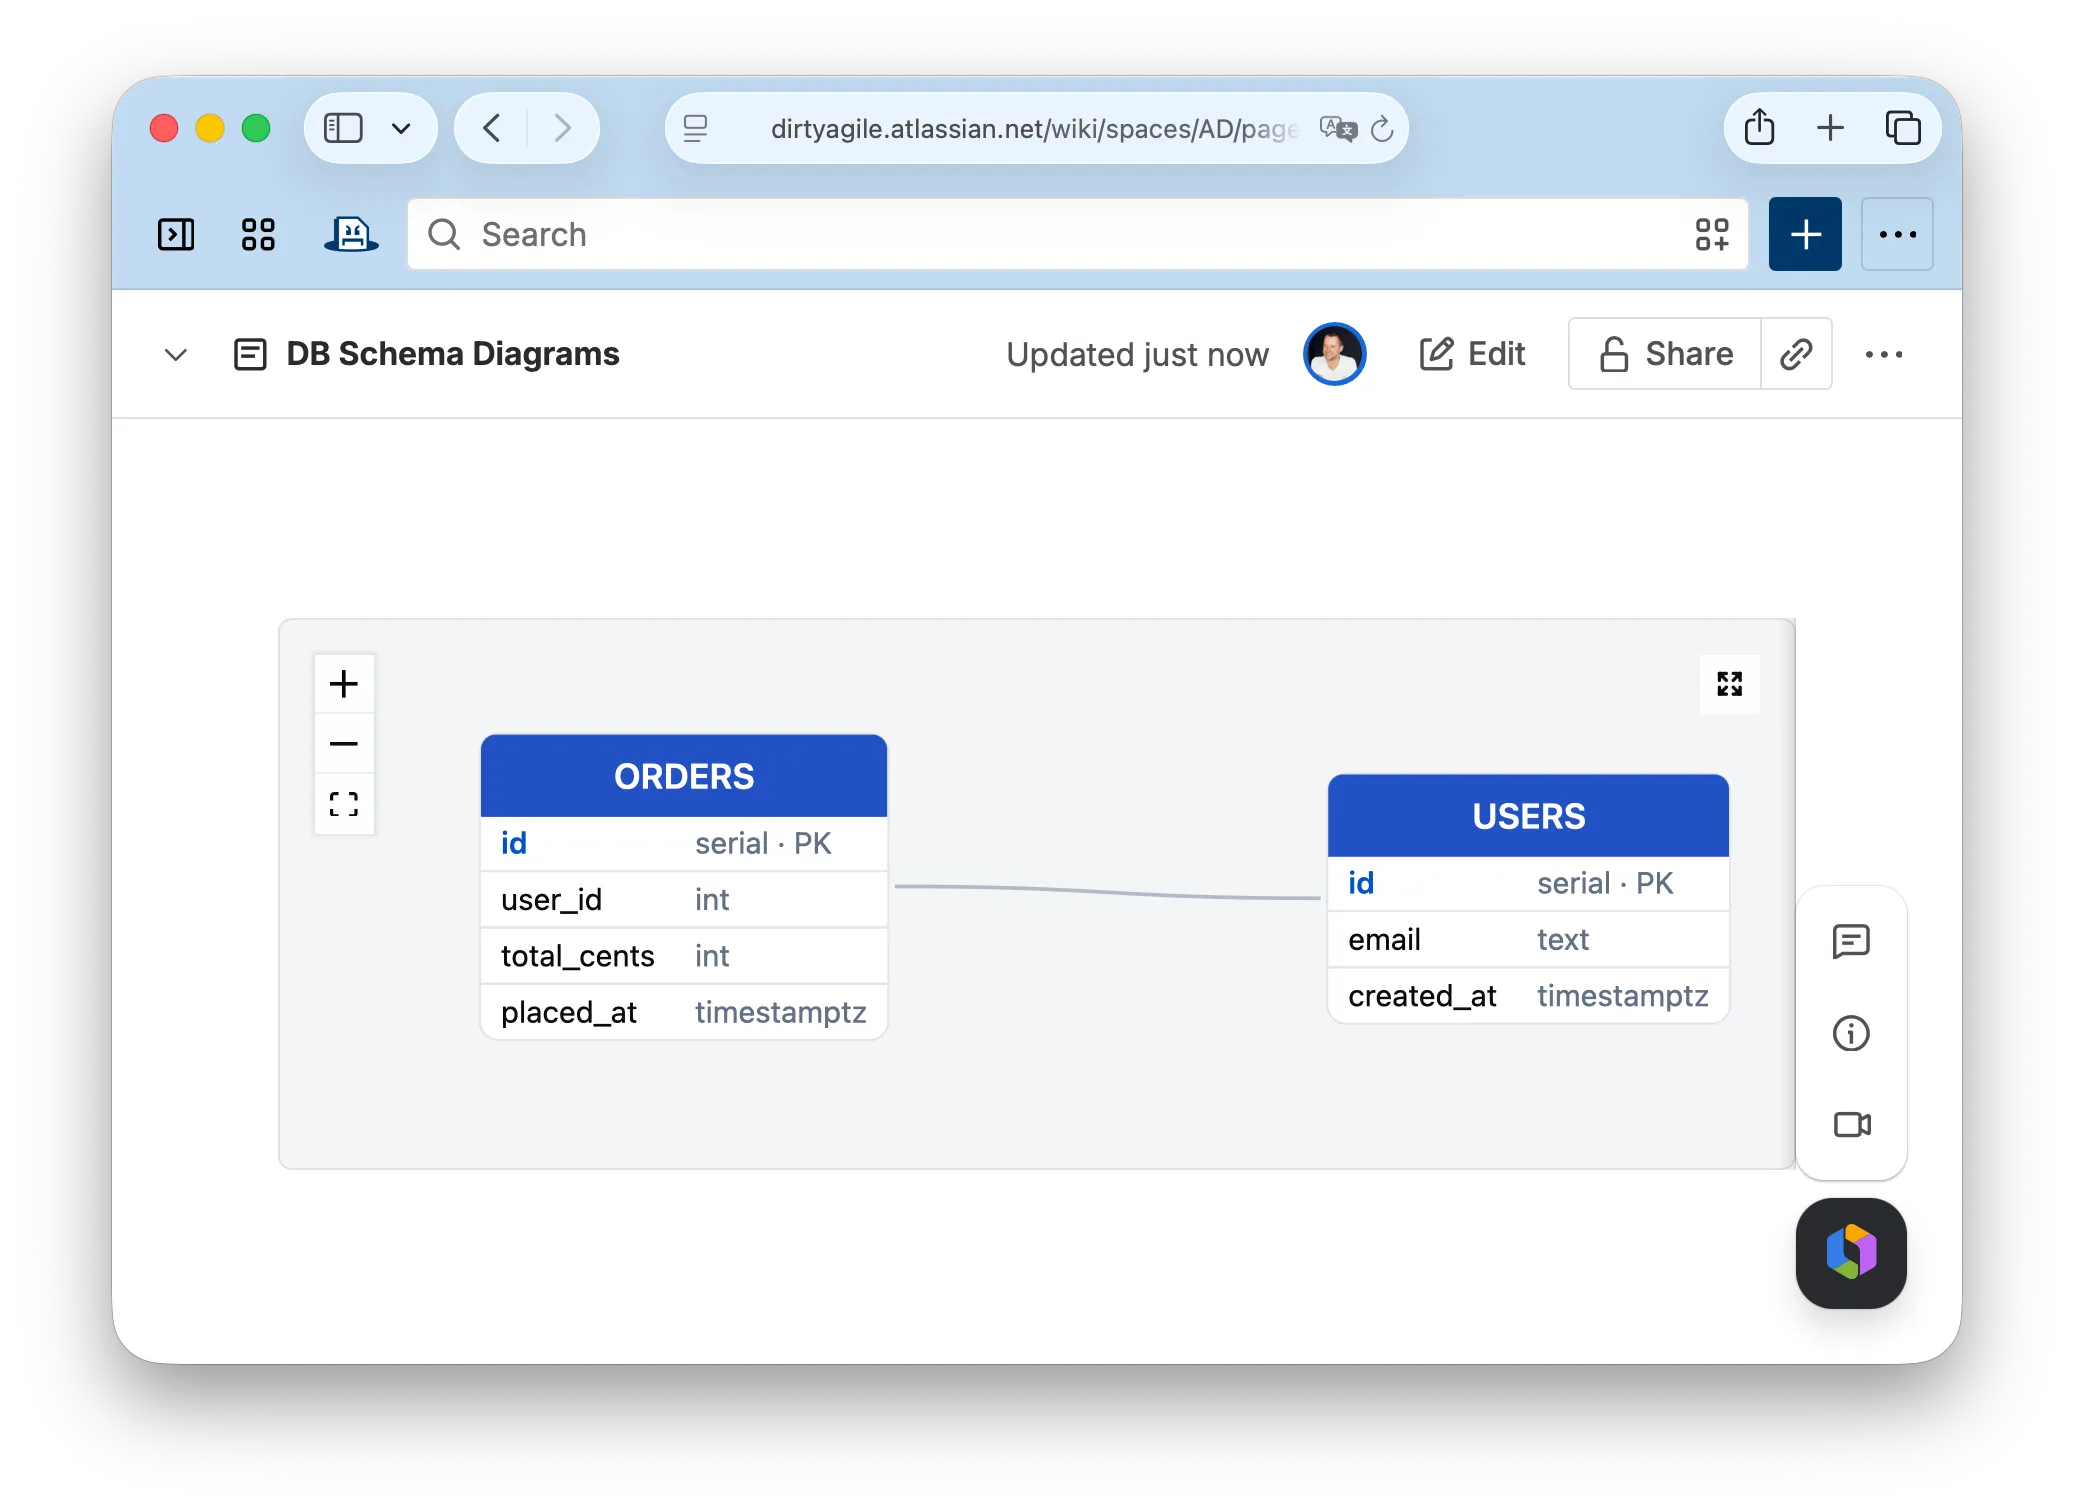
The macro parses the schema: each table becomes a node with its columns and types listed
inside, and foreign key references (REFERENCES users(id)) become connector arrows between
the corresponding tables.
4. Apply auto-layout
The tables land stacked on top of each other after import. Click Auto-layout and the macro arranges them across the canvas — related tables cluster together, connectors route cleanly around nodes.
Drag tables to fine-tune the arrangement. Add color-coding by domain (auth tables, billing tables, event tables) if the schema is large enough to warrant it.
5. Save and publish
Click Save. The macro embeds the live diagram in the page.
Viewers can pan and zoom. Anyone with page edit access can click the diagram to reopen the editor and update it — add a column, draw a new FK arrow, rearrange the layout.
When the schema changes
The diagram is not linked to a live database — it’s a stored snapshot you own and control. When a migration adds a table or changes a column, open the editor, update the relevant node (or re-import the changed tables), and save. Takes about 30 seconds for a small change.
Export
When the page is exported to Word or PDF, the diagram renders exactly as it appears — same layout, same connectors, same colors. No re-drawing for documentation purposes.